Pimoroni's Interstate 75W
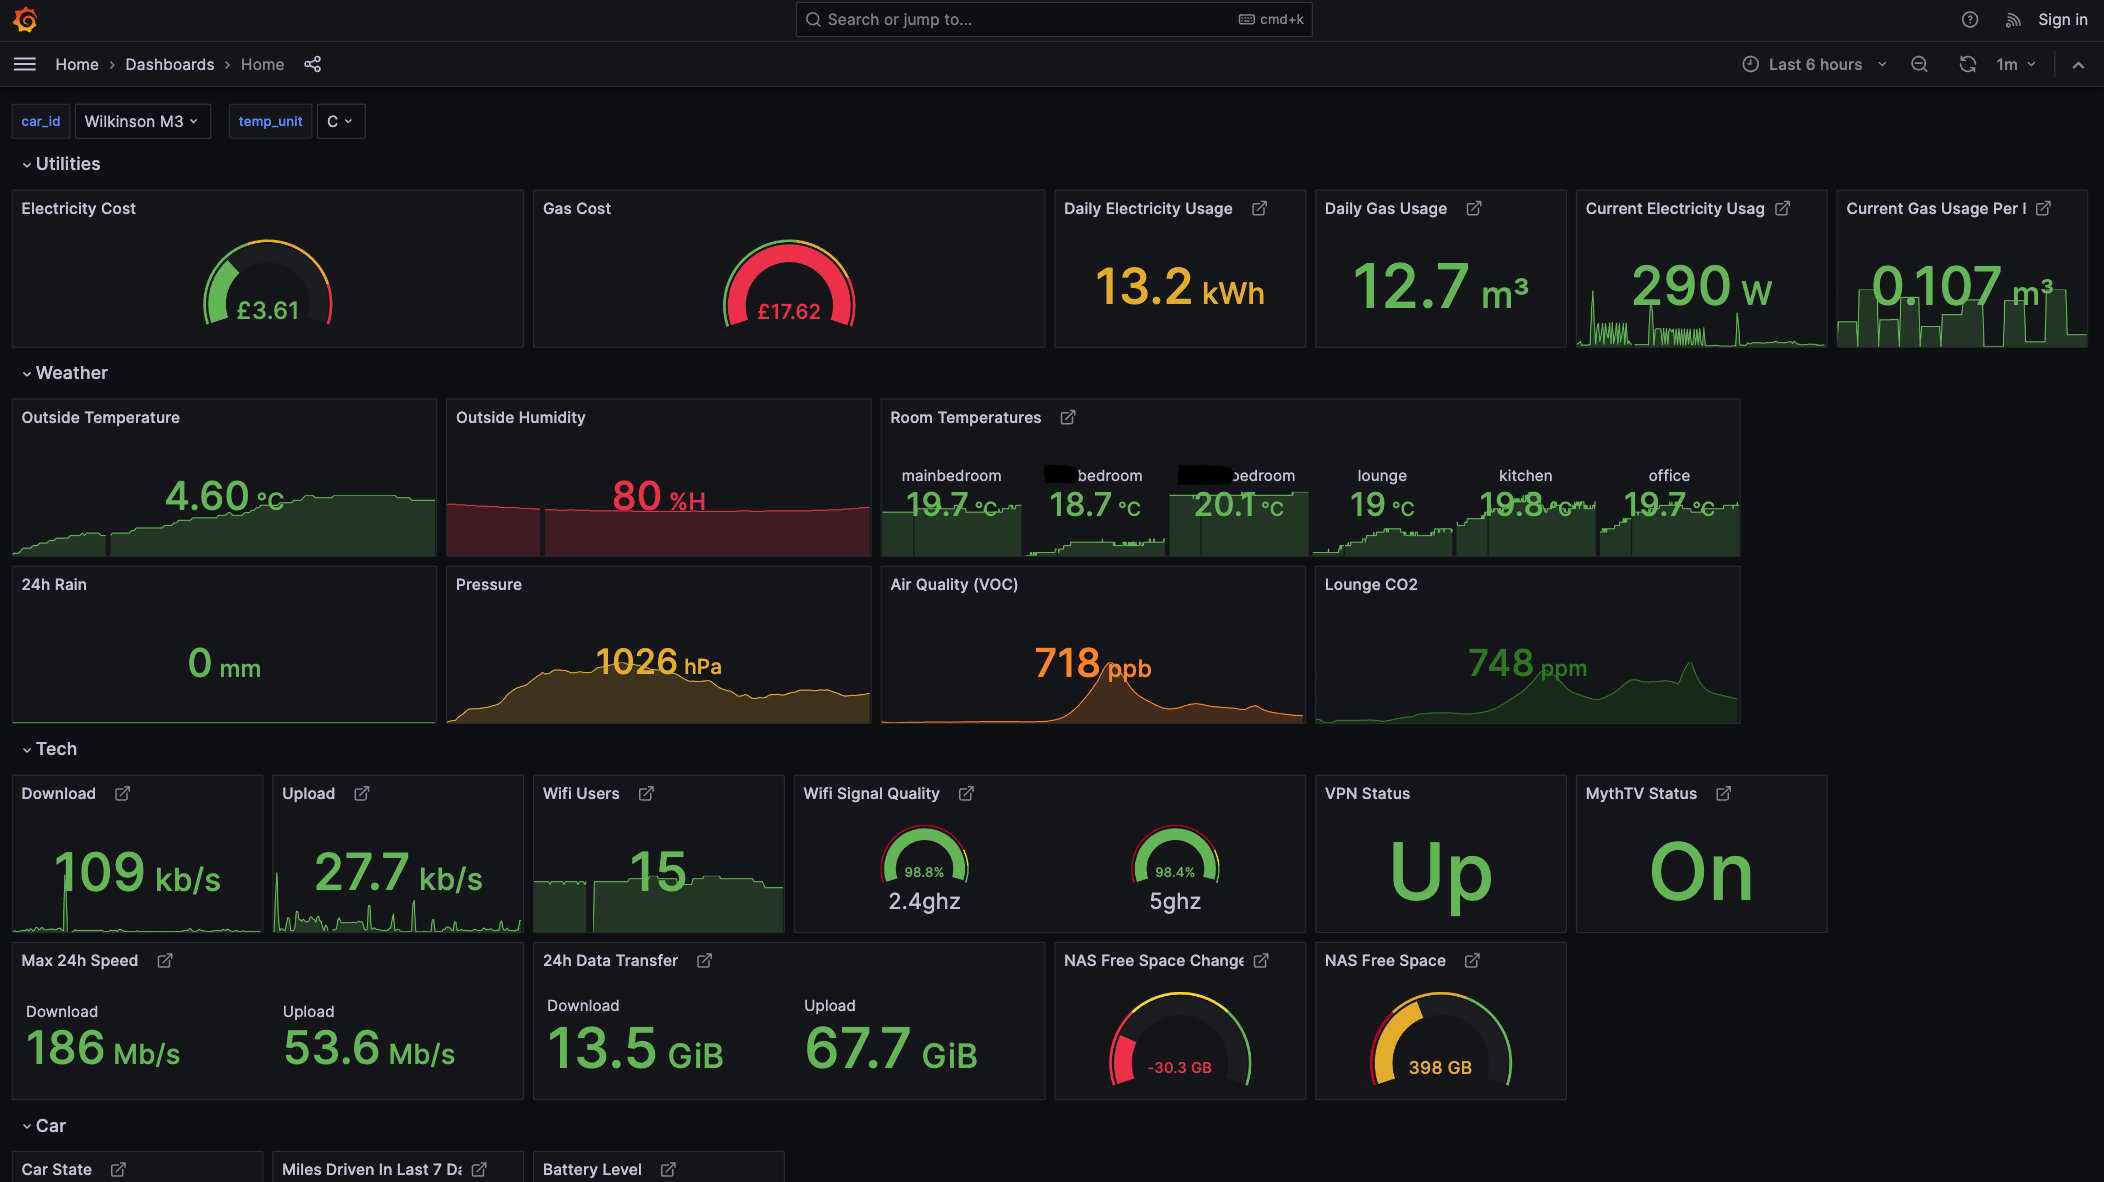
I’ve previously written about my attempts to get metrics about my house into Prometheus and to visualise them with Grafana. This project has gone well, and I can measure everything I want to apart from water usage - please let me know in the comments if you have a suggestion on how to do that! The one thing that’s missing is a “glanceable” display. My Grafana dashboards work well when I’m at my computer, but they’re not so great when cooking in the kitchen.
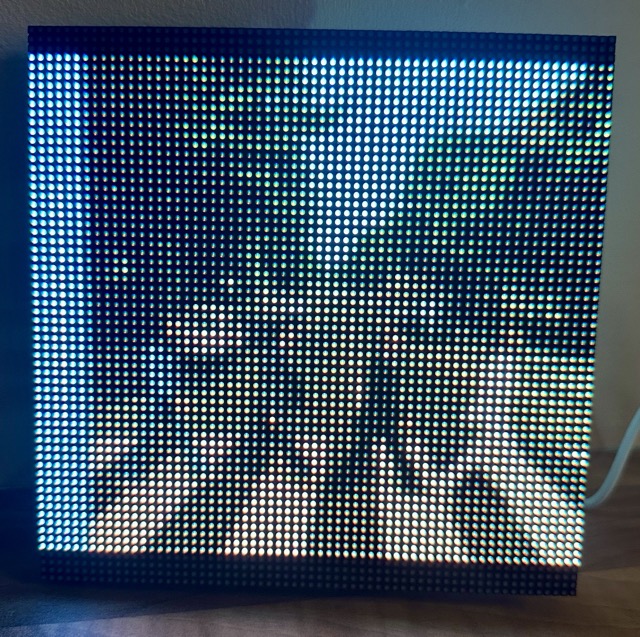
To solve this I purchased an Interstate 75W from Pimoroni, and a 64x64 2.5mm pitch LED matrix panel. This is a Raspberry Pi Pico W, with some additional software and hardware to make driving LED matrix panels easy. The Pico W contains an RP2040 processor, 264kB RAM and 2MB of flash memory, a USB port and wifi/bluetooth support.
Assembling the panel is easy as the board slots into a space on the panel easily, and connects with a couple of provided wires. Just don’t forget to connect the power cable as well as the data cable (as I did), as without it it powers up but the colours look very strange and you’ll be confused for a while.
Getting started with the board is straightforward as Pimoroni provide an excellent guide, and a custom version of MicroPython with some baked-in extra libraries to make drawing on the display straightforward. It was only a matter of a few minutes after unboxing before I had something appearing on the panel.
The additional libraries have a lot of useful functionality, like drawing lines and shapes, images, text, etc. However, I quickly discovered that the development process was not quite as slick as I would like. There’s no way to run your code on your PC - it will only run on the physical hardware. Given I would like to mount the panel in my kitchen, having to plug it in every time I wanted to work on a change was going to be impractical.
Partly to solve that inconvenience, and partly because I don’t like to make things easy on myself, I built my own library, i75. This builds on top of Pimoroni’s MicroPython libraries, but only uses the ability to set individual pixels. It also abstracts the Interstate 75 away, so when running on a PC it mimics the panel using PyGame.
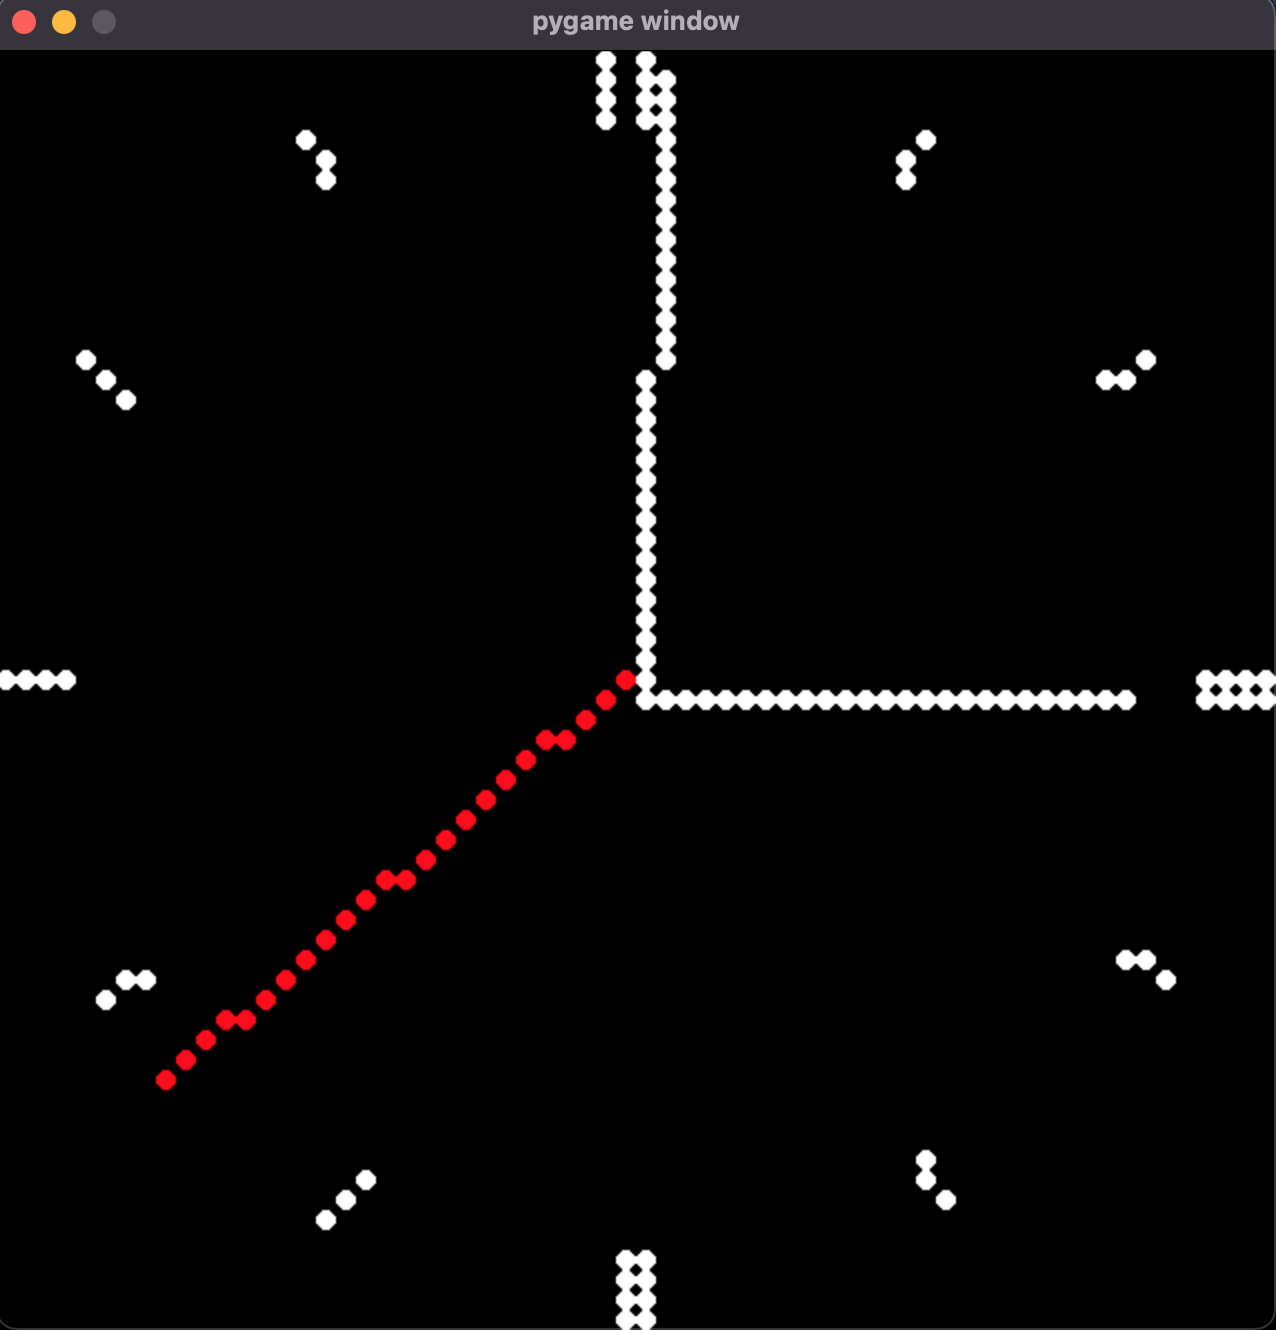
This approach has several problems, in particular, it runs on Python3 which MicroPython attempts to replicate, but the standard library is very different. The Pimoroni’s build of MicroPython only emulates single precision floating point numbers, which caused me some trouble when drawing an analogue clock. And of course, the speed of a PC is about a zillion times quicker than the RP2040, and has essentially no memory limit. Ideally, in future, I’d like to switch to the PC MicroPython build, but for now, the simplicity of using PyGame wins out. I’ve developed the glanceable display without using the physical hardware, so as long as you keep these limitations in mind it works ok.
As I write this I have not yet implemented all the displays I wanted to, but it does display the time, some bouncing balls (mostly as a test of speed), arrival and departure times from my local train station and the album art from whatever’s playing on my Kitchen Sonos.
To further improve the speed of development, and to work around the memory and processor limitations
the display has a frontend and
backend component. The backend is standard Python 3
running in a Docker container on my Synology NAS, and it does all the
communication with downstream systems, and only returns minimal JSON for the display to show
the required information. MicroPython includes a cut-down version of the requests library, which lets
you make HTTP requests and parse the returned JSON.
One interesting challenge was handling Sonos album art. It was pretty obvious that the frontend wouldn’t be able to cope with loading the image directly, but even after retrieving and resizing it memory issues were a problem. The backend loads the album art and track information using SoCo, and then resizes the album cover down to 64x64 using Pillow. I had assumed this would be small enough to send to the frontend easily, as it’s only 12kb, but when I stuck it in the JSON response I would get out-of-memory errors. Processing the JSON allocates quite a bit of memory, but it’s still surprising it fails as there is 120kb available. Instead, I moved the loading of the art to a separate request and passed it as a raw byte stream. This avoids the processing needed to load the JSON, and will only use up 12kb of memory. The Pimoroni libraries support PNG and JPEG, but as mentioned earlier I don’t like making things easy for myself, so I’m trying not to use more features than I have to.
Text handling has been another area I’ve struggled with. With just a 64x64 display getting legible text is difficult. You don’t want too much writing on a “glanceable” display, but for displaying data like song and artists names, it is important. After trying a lot of fonts I decided on CG pixel 3x5, which allows for about 10 lines of text. It only supports capital letters, but for all characters, you need a much denser display to be able to distinguish them clearly.
Unfortunately while dealing with network resources errors are inevitable. By default console output on the Interstate 75W is lost, when not connected to a computer. To work around this I implemented the code below, which attempts to catch all exceptions, post the traceback to my backend server (which logs it) and then restarts. This works well as I can track any errors that occur, and it keeps running rather than needing to be power cycled. I have still experienced some issues with hangs, but I think those are to do with network calls missing timeouts. In future, I might try to add support for Sentry, but for now this keeps things running in event of bugs.
def main_safe() -> None:
    while True:
        try:
            main()
        except KeyboardInterrupt:
            break
        except Exception as e:
            s = StringIO()
            sys.print_exception(e, s)
            s.seek(0)
            log_error(s.read())
            time.sleep_ms(1000)
        except:  # noqa
            log_error("Unknown exception...")
            time.sleep_ms(1000)

def log_error(error: str) -> None:
    try:
        r = urequests.post(f"http://{BACKEND}:6001/error", data=error)
    finally:
        r.close()
I’ve had the panel running for several months so far, and it’s been very reliable. The network connection is stable, and there have been no problems that were not due to my code. The display is very bright and clear, although it would be nice to come up with a box or frame to hide the wires and make the whole package a bit neater. In general, I highly recommend the Interstate 75W if you’re looking for a display for a home project.
As I continue to develop the library and the frontend I will post about any interesting challenges I come across, in between my management-focused posts. Have you done any projects involving an LED display? Let me know in the comments below!
Comments
Hi Andrew!
let's consider using a simulated water sensor using a Raspberry Pi and a flow sensor. Note that the specifics can vary based on the actual hardware you have. In this example, we'll use the `RPi.GPIO` library for GPIO access on a Raspberry Pi. If you're using a different platform or sensor, adapt accordingly.
First, install the required library:
```bash pip install RPi.GPIO ```
Now, a simple example using a hypothetical flow sensor:
```python import RPi.GPIO as GPIO import time
class WaterSensor:
def __init__(self, pin):
self.pin = pin
GPIO.setmode(GPIO.BCM)
GPIO.setup(self.pin, GPIO.IN)
def get_water_usage(self):
try:
pulse_count = 0
last_state = GPIO.input(self.pin)
while True:
current_state = GPIO.input(self.pin)
if current_state != last_state:
pulse_count += 1
last_state = current_state
time.sleep(0.1) # Adjust sleep time based on your sensor's characteristics
except KeyboardInterrupt:
# Cleanup GPIO on keyboard interrupt
GPIO.cleanup()
# Assuming the flow sensor is connected to GPIO pin 17 sensor = WaterSensor(pin=17)
try:
# Fetch water usage from the sensor
water_usage = sensor.get_water_usage()
# For demonstration purposes, print the water usage every 5 seconds
while True:
print(f"Water Usage: {water_usage} pulses")
time.sleep(5)
except KeyboardInterrupt:
print("\n Exiting...")
finally:
GPIO.cleanup()
```
Note that this is a simplified example, and the actual implementation might vary based on your specific flow sensor and hardware setup. Make sure to consult your sensor's datasheet and wiring diagrams for accurate integration.
Rafa Ruiz
11 Jan 2024
We've just had a smart meter installed by Anglian water.. the closest I've got is a bit of web scraping - https://community.home-assistant.io/t/integrating-anglia-water-usage-for-smart-meters-uk/596671/99 - although I've not actually bothered with it yet... I should really, though, because otherwise it's just flushing money down the toilet!
james H
05 Mar 2024