Router Stats To Prometheus
I’ve previously written about my plan to collect much more data about my house. In the current work-from-home environment the quality of our internet connection is paramount, and I wanted to be able to monitor it and potentially be alerted to any degradation before it becomes an issue.
Although I’ve replaced my wifi with a UniFi based system, I still use the router that was supplied by my ISP - which is a ZyXEL VMG1312-B10D. Like most networking equipment the ZyXel supports SNMP which is a technology for reading and writing stats and configuration from equipment, and aggregating them together. On paper it sounds great, but unfortunately SNMP is a nightmare to work with, and you need a mapping file for each device, which doesn’t exist for this model. After looking into creating this mapping, and integrating my preferred technology slack of Grafana and Prometheus, I decided to change tack and extract the data myself.
Fortunately the router UI contains some plain text data which looks easy to scrape. So, filled with confidence that this would be an easier approach that learning SNMP I spun up a GitHub project and got to work cranking out some code.
============================================================================
    VDSL Training Status:   Showtime
                    Mode:   VDSL2 Annex B
            VDSL Profile:   Profile 17a
                G.Vector:   Disable
            Traffic Type:   PTM Mode
             Link Uptime:   1 day: 4 hours: 28 minutes
============================================================================
       VDSL Port Details       Upstream         Downstream
               Line Rate:      7.881 Mbps       39.998 Mbps
    Actual Net Data Rate:      7.853 Mbps       39.999 Mbps
          Trellis Coding:         ON                ON
              SNR Margin:        5.7 dB            7.3 dB
            Actual Delay:          0 ms              0 ms
          Transmit Power:      - 2.6 dBm          11.4 dBm
           Receive Power:      -20.8 dBm         -11.0 dBm
              Actual INP:        0.0 symbols      55.0 symbols
       Total Attenuation:       18.2 dB           22.4 dB
Attainable Net Data Rate:      7.853 Mbps       47.093 Mbps
============================================================================
      VDSL Band Status    U0      U1      U2      U3      D1      D2      D3
  Line Attenuation(dB):  7.2    40.1     N/A     N/A    18.1    50.3    77.6
Signal Attenuation(dB):  7.2    39.9     N/A     N/A    20.0    50.1     N/A
        SNR Margin(dB):  5.5     5.7     N/A     N/A     7.3     7.3     N/A
   Transmit Power(dBm):-13.7   - 3.0     N/A     N/A     8.9     7.8     N/A
============================================================================
The first step to implement this was to investigate how the built in UI requests this data. An early discovery was that when accessing using HTTP responses are encrypted with AES and then decrypted in Javascript. When accessing with HTTPS (which uses a self-signed ZyXEL certificate) responses are in plain text.
Unfortunately, but perhaps not unsurprisingly, at this point I hit what appears to be a bug in the router. The stats work well for a few hours, but then the router stopped responding. Even more strangely after this occurs it was impossible to log in manually to the web UI - the router responded with a username or password is not valid error. Seemly the only solution was to reboot the router. Extending the Prometheus scrape interval extended the time that the stats worked for, but eventually the same error reoccurred.
Given there’s no way to see what was happening inside the router, and therefore it’s unlikely I could work
around the bug a different strategy was needed. Digging around the router UI revealed that you could turn on
ssh access. Connecting to that gives you a simple shell, that seems to replicate most of the web UI. The commands
xdslctl info and ifconfig return information about the speed of the internet connection, and statistics about
the number of bytes sent and received.
ZySH> xdslctl info
xdslctl: ADSL driver and PHY status
Status: Showtime
Last Retrain Reason:  1
Last initialization procedure status:  0
Max: Upstream rate = 7987 Kbps, Downstream rate = 46854 Kbps
Bearer: 0, Upstream rate = 7987 Kbps, Downstream rate = 40000 Kbps
Bearer: 1, Upstream rate = 0 Kbps, Downstream rate = 0 Kbps
The excellent Paramiko library makes it easy to connect to an SSH server, and despite
a few problems caused by the fact that ZySH is clearly ZyXel’s own implementation of a shell, and it doesn’t quite
work how Paramiko expects, it was simple enough to get the data returned by these commands into a string that I could
parse. A few regular expressions
later and it’s turned into
a set of Prometheus metrics. Using the built in Python HTTP server makes it
easy to serve them up for
Prometheus to scrape.
The last step is to create a Dockerfile, which is only a few lines long. It installs the library from PyPI and then runs the app in daemon mode when started.
Docker expects arguments to be provided using environment variables, but the Python argparse library doesn’t make
it as easy as perhaps it could to accept argument either on the command line, or by environment variable. To work
around this I needed to write
some code to check the
environment variable if the equivalent command line option wasn’t set. Once that was in place I could configure
the relevant password using the Docker Compose env_file option, which reads environment variables from a file.
  zyxel:
    image: andrewjw/zyxelprometheus:0.5.2
    container_name: zyxel
    ports:
      - 9101:9100
    env_file:
      - ./secrets/zyxel
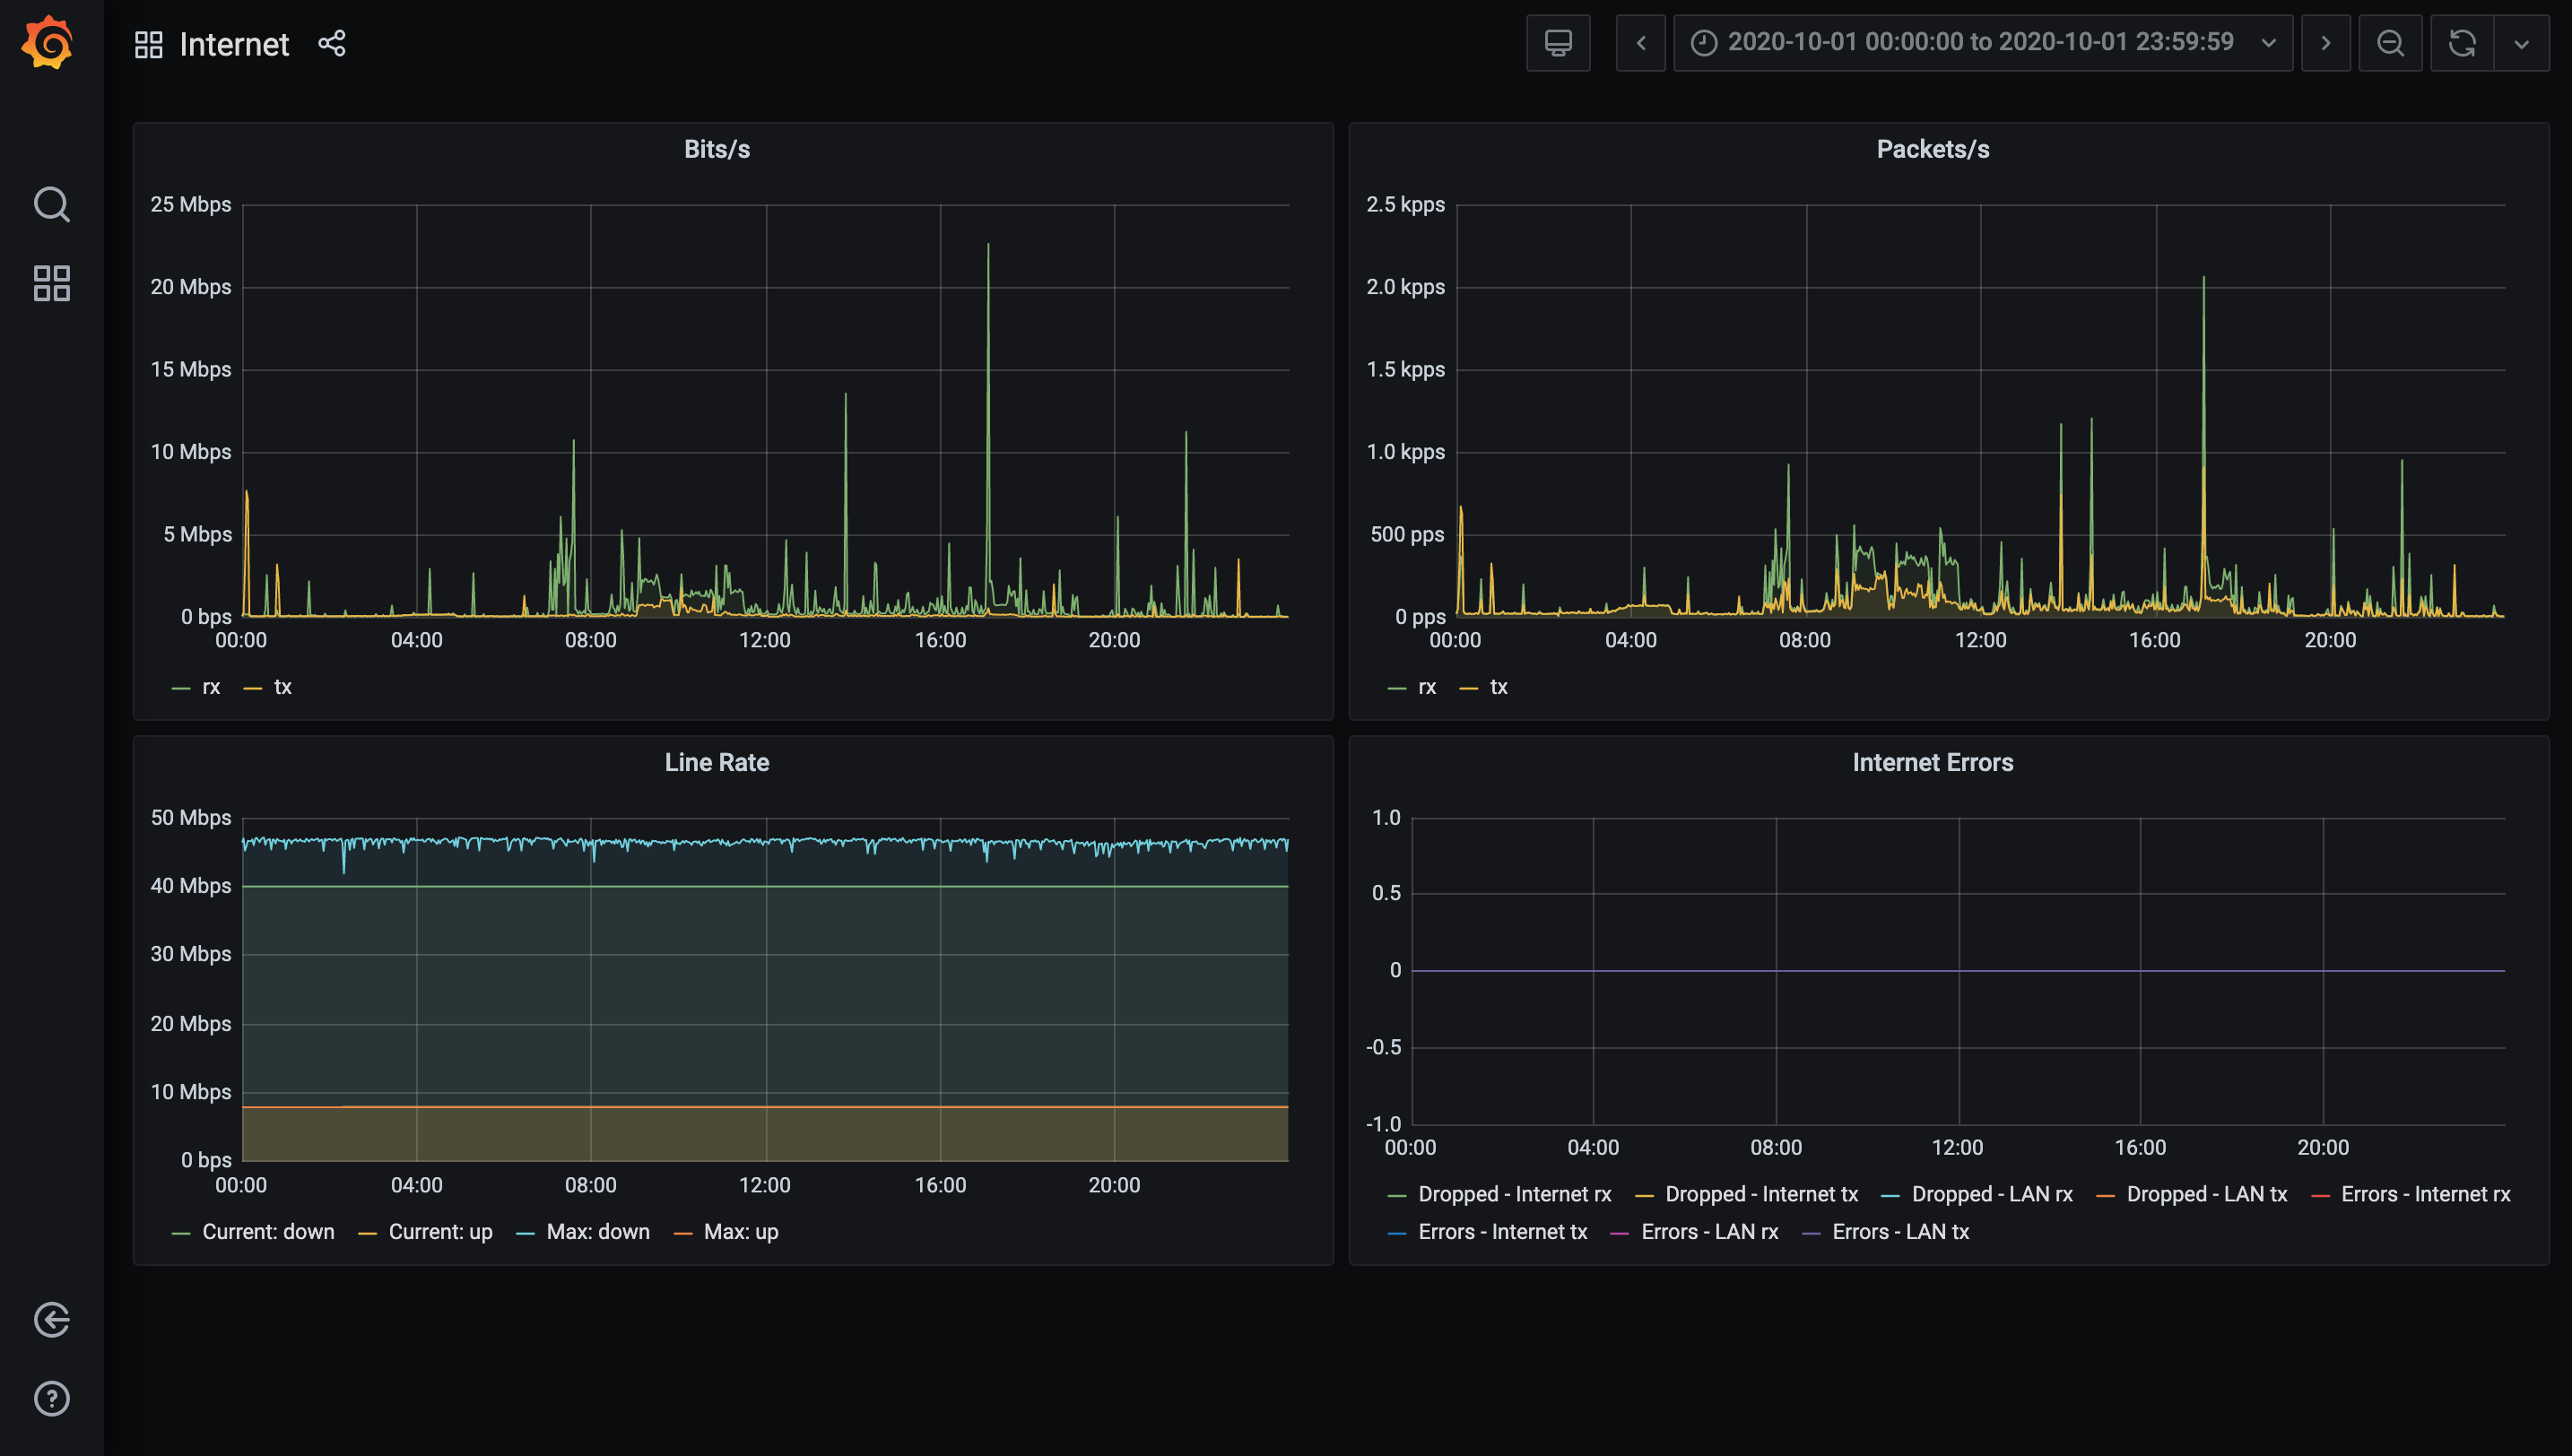
Using the SSH interface appears to be much more reliable the than the web UI, and has been running for several weeks with no issues at this point. I’ve currently not got any alerts configured (no point in emailing if the connection is down), but next time there are complaints about slow internet at least I’ll have the statistics to investigate.
At the moment the code is specific to my brand and model of router, so it’s not that widely useful. If your router has an SSH interface, feel free to open a pull request with support. I’d love to support more routers, even non-ZyXel ones.
Comments
I did about the same odysee than you to get some statistics of my zyxel device. But I failed at the end to call commands on the zysh shell. So many thanks for your efforts and code!!
Daniel
23 Jan 2025