House Measurements

For a long time now I’ve tracked the weather outside my house with my weather station. I also have smart electric and gas meters which display my usage on a little screen in my kitchen, but I didn’t try to do anything useful with that data. Recently I brought an electric car and given that it’s essentially a giant iPad on wheels it inspired me to look into what data I could collect from it, and from elsewhere in my house.
Towards the end of last year, I upgraded my Synology NAS to a newer model which has an Intel, rather than MIPS processor, partly because it was old and I was worried about it dying, but mostly so I could run Docker containers on it. I’ve been running both a Ubiquiti UniFi Controller and PiHole since then, but I knew as part of this project I’d want to run many more containers so I took the opportunity to tidy up the setup.
Docker Compose is a tool that sits above the normal docker command and it lets you run multiple docker containers while simplifying
the management of images and the options you need to set for the container to work correctly. You can find my docker-compose.yml file
here.
At work we make extensive use of Prometheus for recording our metrics and Grafana to display them, so they were the obvious choice for my home monitoring as well. Both are incredibly easy to set up, with Docker containers already available.
One key metric I knew I needed to track was the amount of free space on my NAS. I’m a long time MythTV user,
and my kids record vast quantities of Hey Duggee which I need to keep an eye on. Fortunately, the Prometheus
team makes this easy by providing node-exporter, which produces all the metrics you might
want to monitor on a server, including disk space. If you run it inside Docker container then by default it will give you stats from
inside the container, but by mounting some key directories inside the container you can get metrics for the whole machine.
  node-exporter:
    privileged: true
    image: prom/node-exporter:v1.0.1
    container_name: node-exporter
    restart: always
    network_mode: host
    ports:
      - 9100:9100
    volumes:
      - /proc:/host/proc:ro
      - /sys:/host/sys:ro
      - /:/rootfs:ro
      - /volume1:/volume1:ro
    command:
      - "--log.level=debug"
      - "--path.procfs=/host/proc"
      - "--path.sysfs=/host/sys"
      - "--collector.filesystem.ignored-mount-points"
      - "^/(rootfs/)?(dev|etc|host|proc|run|sys|volume1/@docker)($$|/)"
Above a certain level, I don’t particularly care about the absolute amount of disk space, what matters is the direction it’s trending.
To highlight when I need to look at the amount of TV being recorded I set an alert to trigger when we dropped more than 20Gb of disk space in
a week. The rules.yml file below includes an expression to check the delta of the free space over the last seven days. Connecting an
alertmanager instance means I get an email alert which will prompt me to delete
any recordings we don’t want any more.
groups:
  - name: Alerts
    rules:
      - alert: NASDiskSpaceChange
        expr: delta(node_filesystem_avail_bytes{mountpoint="/"}[7d])/1024/1024/1024 < -20
        for: 1h
        annotations:
          title: 'NAS Disk Space Change Too Negative'
        labels:
          severity: 'low'
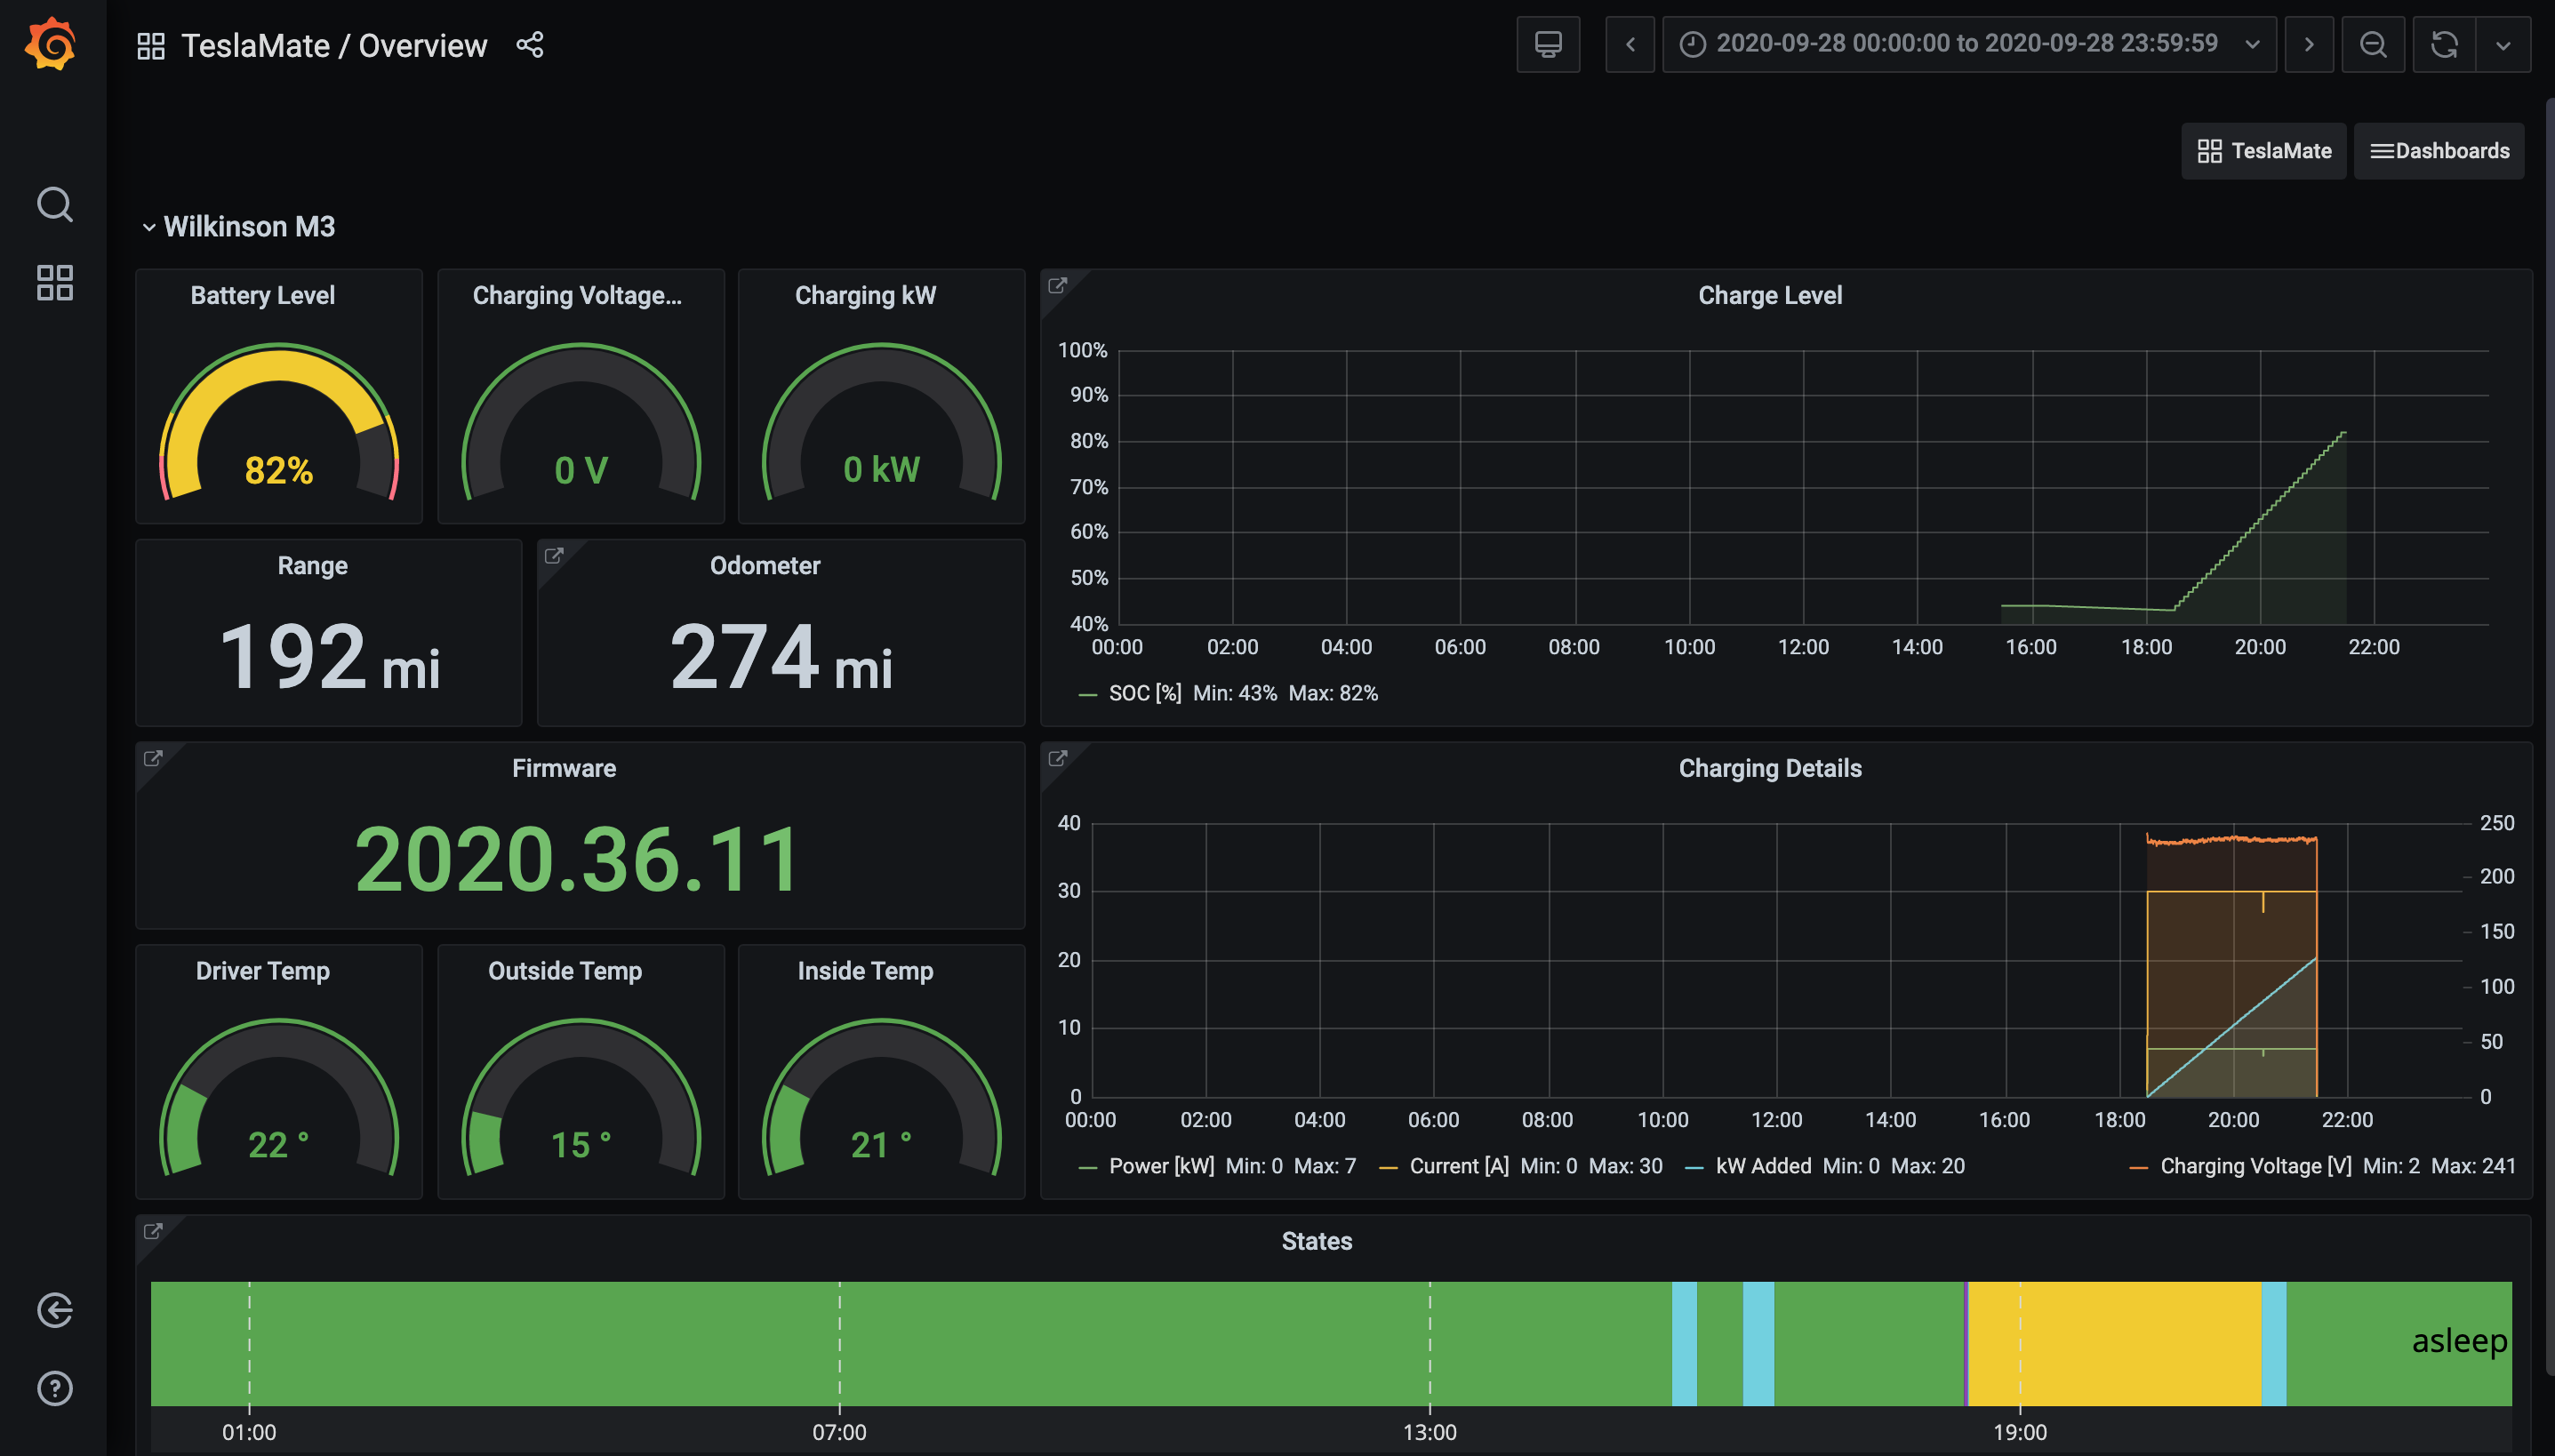
I mentioned that it was getting an electric car that triggered me to think about how much data I could collect from my house. To track my car statistics I’m using the excellent TeslaMate. They provide excellent documentation about getting started with Docker Compose, so I won’t repeat that here. One change I did make was to not use the provided Grafana image, as I wanted to make my own dashboards. Instead, I use a vanilla container and use Grafana provisioning to deploy the TeslaMate dashboards. I’ve checked out their repository on my host computer and mounted the dashboards directory inside Grafana. Using a provisioning yml file will then automatically include the dashboards in Grafana instance, along with any custom ones that are defined.
There’s not much to say about TeslaMate, it was extremely simple to set up and although I’ve not had my car for long, has worked perfectly so far.
While tracking server metrics is a solved problem, tracking other household data is less common. In future posts, I’ll talk about tracking data from my router, our weather station and our electricity and gas usage.
Comments